 AI Essay

On this page
Free survey planning tool
Estimate completed responses
Set the precision for one population proportion. The result assumes a probability-based simple random sample.
Your calculation runs in this browser. The values you enter are not sent to AI Essay.
Choose your assumptions, then calculate the completed-response target.
Planning estimate
- Initial large-population estimate
- Known population size
- Assumed completed-response share
- Rough invitations to plan
- Calculation assumptions
A completed-response target is not an invitation count. The estimate does not correct nonresponse, coverage or selection bias, clustered or weighted designs, or subgroup analyses.
What this survey sample size estimate means
The result is a target number of completed responses for estimating one population proportion under a probability-based simple random sample. For example, a researcher might estimate the proportion of eligible students who select one answer to a clearly defined question. The confidence level describes the long-run coverage of the method under its assumptions; the margin of error is the chosen absolute precision in percentage points.
This is a planning calculation, not a guarantee that a survey result represents its intended population. A larger response count does not repair a biased sampling frame, voluntary-response bias, nonresponse or a poorly worded question. Describe who was eligible, how people were selected and how many responded when reporting a real survey.
Supporting reading: [3]
Formula and a worked 95% example
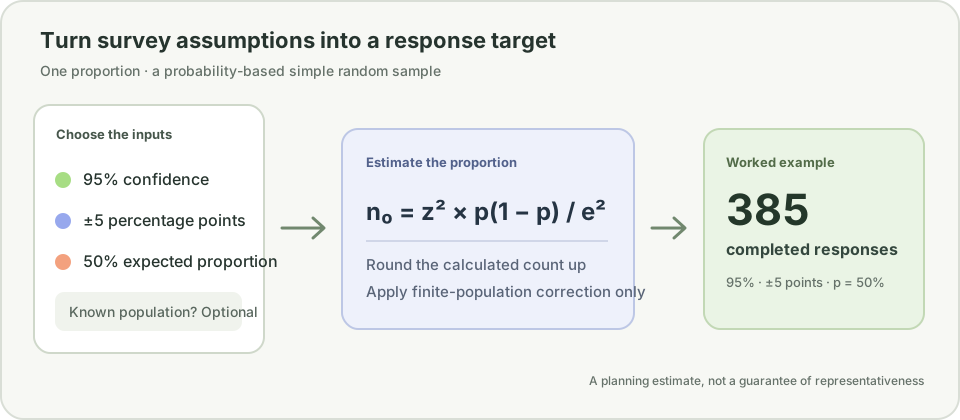
For a large population, the initial estimate is n₀ = z² × p × (1 − p) ÷ e². Here, z is the two-sided normal critical value for the selected confidence level, p is the expected proportion written as a decimal, and e is the absolute margin of error written as a decimal. The calculator rounds the required response count up to a whole number.
With 95% confidence, a ±5 percentage-point margin of error and no reliable prior estimate for p, using p = 50% gives an initial estimate of 385 completed responses. Fifty percent maximizes p × (1 − p), so it is a conservative planning choice when the underlying proportion is unknown. If you have a credible estimate from a comparable population and question, enter it and explain that basis in your methods.
When to use the finite-population correction
Enter a population size only when your target population is a known, bounded group and you can define who belongs in it. The correction is n = n₀ ÷ [1 + ((n₀ − 1) ÷ N)], where N is the population size. In the same 95%, ±5-point, 50% example, a defined population of 2,000 gives an adjusted target of 323 completed responses.
Do not enter the number of people you hope to reach as the population size. If the population is very large, not well defined or changes during data collection, leave this field blank. The correction changes the precision calculation for sampling without replacement from a finite population; it does not correct coverage, selection or response bias.
Estimate invitations without confusing them with responses
The optional completed-response share converts the response target into a rough invitation estimate: invitations = completed-response target ÷ expected completion share. For example, a 50% planning assumption doubles a 385-response target to 770 invitations. Use a rate from a comparable collection plan or pilot when you have one; the example is arithmetic, not a forecast.
This optional estimate is not a formal AAPOR response rate. AAPOR outcome rates use final case dispositions and eligibility information, and response rates alone do not show whether nonresponse bias is present. Delivery failures, ineligible cases, repeated invitations and different survey modes can change the number of cases you need to contact. Record how you chose your assumption and report the appropriate outcome rate for the study design.
Check whether this is the right calculator
This tool covers one proportion and a probability-based simple random sample. It does not estimate a mean, test a hypothesis, calculate statistical power, compare two groups, size each subgroup or adjust for clustering, stratification, weighting, nonresponse or design effects. Those questions require different inputs and, for complex survey designs, a method that reflects the actual sampling plan.
The margin of error is not a statement about every source of survey error. It describes sampling precision under the selected model. Question wording, who was invited, who responded, missing answers and how the survey was administered still need separate review. A separate confidence-interval reading exercise shows how to explain an estimate and its uncertainty in a results paragraph.
Questions about this topic
How many completed responses do I need for a survey?
It depends on the population parameter, confidence level, margin of error, expected proportion and sampling design. This calculator estimates responses for one population proportion under a probability-based simple random sample.
What should I enter for expected proportion if I do not know it?
Leave the default at 50%. For a proportion, that choice maximizes p × (1 − p) and gives a conservative initial estimate. A different value should come from a defensible estimate for a comparable question and population.
Does a 95% confidence level mean 95% of respondents will answer correctly?
No. It describes the long-run coverage of the interval-estimation procedure under its assumptions. It does not describe respondent accuracy or guarantee that one realized survey interval contains the population value.
Should I include a population size?
Only when the target is a well-defined, known finite population sampled without replacement. Otherwise leave it blank; an uncertain population count can make the finite-population adjustment inappropriate.
How many survey invitations should I send?
Enter an expected completed-response share based on a comparable collection plan or pilot. The calculator divides the required completed responses by that assumption and rounds up. This rough invitation estimate is not a guarantee and does not correct nonresponse bias.
Does this calculate a formal survey response rate?
No. It estimates a planning count from an assumption you enter. AAPOR outcome-rate calculations use final case dispositions and eligibility information; response rates alone do not show whether nonresponse bias is present.
Can I use this for a poll, experiment or comparison between groups?
Not as a general sample-size answer. Non-probability polls, experiments, comparisons, subgroup estimates, means and statistical-power questions use different assumptions and calculations. Match the method to the study design.
Are my inputs sent to AI Essay?
No. The calculation runs in this browser. The values you enter are not uploaded to this site.
Sources and editorial notes
The supporting reading below informs our editorial guidance. Exercises and scenarios illustrate a method; they do not report a completed product test or measured learning outcome. Read our editorial policy or send a correction with a supporting source to info@ai-essay.com.
- University of Florida IFAS Extension: sample size for estimating a proportion and finite-population correction
- Penn State STAT 506: sample size determination for a proportion and finite populations
- NIST/SEMATECH e-Handbook: selecting sample sizes and assumptions for proportion estimates
- CDC/NCHS: variance estimation and sample design for complex surveys
- AAPOR: response rates, outcome-rate definitions and limits of response-rate interpretation
- AAPOR Standard Definitions: disposition codes and survey outcome rates