 AI Essay

On this page
When a paired t-test fits
A paired t-test compares the mean of within-pair differences with a stated null value, which this calculator fixes at zero. Use it when the measurements are linked by the study design—for example, two measurements on the same participant or a defensible one-to-one match between cases. Enter the matching first and second measurements on the same numbered rows.
Pairing is a property of the design, not something a calculator can infer from similar row order. Two unrelated groups do not become paired because their records happen to be listed side by side. For independent groups, use a method designed for independent samples instead. This tool does not calculate power or determine whether the study has enough participants.
Calculation and a worked example
For each pair, the calculator forms dᵢ = secondᵢ − firstᵢ. It finds the mean difference d̄ and the sample standard deviation sᵈ of those differences, using n − 1 in the variance denominator. The standard error is sᵈ ÷ √n, the test statistic for H₀: μᵈ = 0 is t = d̄ ÷ (sᵈ ÷ √n), and the degrees of freedom are n − 1. The reported two-sided p-value and confidence interval come from that t distribution.
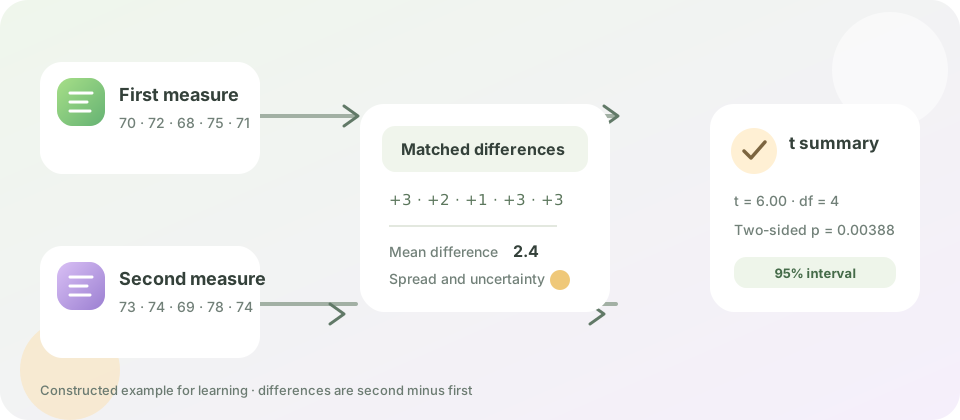
Constructed example: five first measurements are 70, 72, 68, 75 and 71; their matched second measurements are 73, 74, 69, 78 and 74. The differences (second − first) are 3, 2, 1, 3 and 3. Their mean is 2.4, sample standard deviation is about 0.894, and standard error is 0.400. This gives t = 6.00 with 4 degrees of freedom, a two-sided p-value of about 0.00388, and a 95% confidence interval for the mean difference of about 1.289 to 3.511. These constructed values demonstrate the arithmetic; they are not study findings or a threshold for importance.
Assumptions to review before interpreting the result
Each first and second value must form a genuine pair, and the pairs should be independent of one another under the study design. The t procedure concerns the distribution of the paired differences. With a small sample, inspect those differences for strong skew and influential outliers; the tool does not test normality or decide whether the model is appropriate. A larger sample does not repair biased sampling, dependence between pairs or a flawed measurement design.
A confidence interval describes uncertainty in the population mean difference under the method and its assumptions. The p-value is not the probability that the null hypothesis is true, and a small p-value does not establish causality or practical importance. Choose an analysis and any decision threshold before interpreting results, then report the pairing, direction, number of pairs, mean difference, interval, statistic, degrees of freedom and p-value.
When to choose another method
Use a different procedure when the observations are independent, when the outcome is a category rather than a numeric measurement, or when repeated measures and clustering require a model that accounts for their structure. For two reviewers assigning nominal labels to the same items, a Cohen’s kappa calculation answers an agreement question rather than a mean-change question.
An estimate of one survey proportion is a different planning task and does not calculate power for this paired test. Practise describing a confidence interval without treating it as a guarantee.
Free matched-pairs calculator
Compare paired measurements
Enter one number per line in each column. Rows must stay aligned; differences are calculated as second measurement minus first.
First: 70 · 72 · 68 · 75 · 71
Second: 73 · 74 · 69 · 78 · 74
Your calculation stays in this browser tab. Do not enter identifiable or confidential measurements on a shared device.
The example contains 5 aligned pairs. Edit either column, then calculate.
Paired-difference summary
Mean difference (second − first)
Two-sided p-value
Confidence interval
Pairs
- Mean of first measurements
- Mean of second measurements
- Standard deviation of differences
- Standard error
- t statistic
- Degrees of freedom
| Pair | First | Second | Difference |
|---|
Review the study design and difference distribution. This calculation does not check pairing, independence, outliers, normality, sampling bias or practical importance.
Questions about this topic
What data do I enter in a paired t-test calculator?
Enter two numeric columns with the same number of rows. Row one in both columns must refer to the same participant or matched case, row two to the next pair, and so on. The calculator computes second minus first for every row.
What is the difference between a paired and independent t-test?
A paired t-test analyzes one difference for each meaningful pair, such as measurements on the same person at two times. An independent-samples test analyzes unrelated groups and uses a different standard error and assumptions.
Which assumptions does the paired t-test make?
Pairs must be meaningful and independent across cases. The inference is based on the distribution of the within-pair differences; with a small sample, strong skew or outliers can be consequential. This calculator does not assess those conditions for you.
What does the two-sided p-value mean?
Under the specified null model and its assumptions, it is the probability of obtaining a t statistic at least as far from zero as the observed statistic. It is not the probability that the null hypothesis is true, nor a measure of the size or practical importance of a difference.
Does a small p-value prove that the measurements changed because of a treatment?
No. The test summarizes evidence about a mean difference under its model. It does not establish causality, rule out confounding, or measure whether a difference matters in practice.
Can I use this for two unrelated groups or category labels?
No. Use a method for independent groups when cases are not paired. For two reviewers assigning nominal categories to the same items, use an agreement method such as Cohen’s kappa instead.
Are my measurements uploaded?
No. The calculation runs in this browser tab. Values you enter are not sent to AI Essay.
Sources and editorial notes
The supporting reading below informs our editorial guidance. Exercises and scenarios illustrate a method; they do not report a completed product test or measured learning outcome. Read our editorial policy or send a correction with a supporting source to info@ai-essay.com.
- NIST/SEMATECH e-Handbook: analysis of paired observations
- Penn State STAT 200: paired means t-test and assumptions
- SciPy documentation: Student t distribution and incomplete-beta relationship
- NIST Digital Library of Mathematical Functions: incomplete beta function
- American Statistical Association: statement on statistical significance and p-values