 AI Essay

On this page
Free proportion confidence interval calculator
Calculate a Wilson score interval
Enter the number of observations in the category you are measuring and the total sample size. This tool estimates one proportion after data collection.
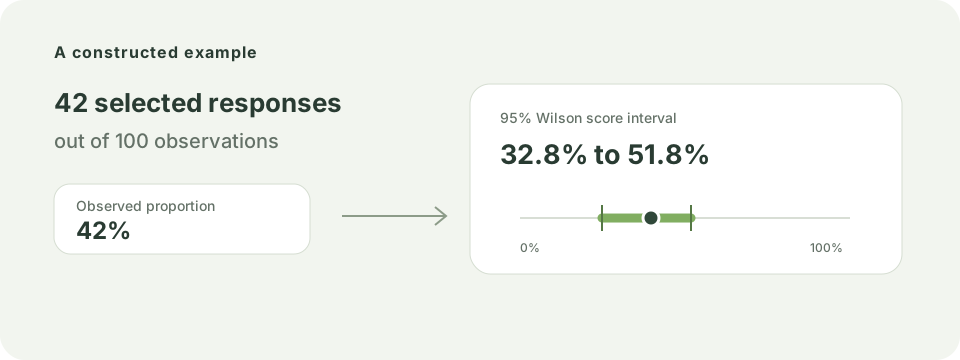
42 selected responses out of 100 gives an observed proportion of 42%. At 95% confidence, the Wilson interval is approximately 32.8% to 51.8%.
Your calculation runs in this browser. The counts you enter are not sent to AI Essay.
The constructed example is ready. Edit the counts, then calculate.
Your interval estimate
Observed proportion
Lower confidence limit
Upper confidence limit
This is a model-based interval for one proportion, not a check of representativeness, nonresponse bias or practical importance. Weighted, clustered and stratified surveys need design-aware variance methods.
What the confidence interval tells you
A sample proportion is the observed count divided by the total number of observations. The interval adds a range of plausible values for the population proportion under the model and sampling assumptions. A 95% confidence level describes the long-run behavior of the method: across repeated samples taken under the same conditions, about 95% of intervals produced by a method with 95% coverage would contain the fixed population proportion. It does not mean there is a 95% probability that this one calculated interval contains the parameter.
The width communicates precision under the model. It does not show whether the sample represents the population, whether the question measured the intended concept or whether a difference is practically important. Report the sample, estimate, interval and collection method together.
Supporting reading: [2]
Worked example: 42 responses out of 100
Suppose 42 of 100 eligible survey responses select a particular option. The observed proportion is 42%. With a two-sided 95% Wilson score interval, the estimated population proportion is about 32.8% to 51.8%. The interval is asymmetric around 42%, which can happen because a proportion is bounded between 0 and 100%.
These numbers are a constructed example to demonstrate the calculation. They are not survey findings. Use your own counts only after deciding how responses were selected, which cases belong in the denominator and how missing answers are handled.
Supporting reading: [1]
How the Wilson score interval is calculated
Let x be the number of successes, n the total sample size, p̂ = x/n the observed proportion and z the standard-normal critical value for the selected two-sided confidence level. The Wilson center is (p̂ + z²/(2n)) / (1 + z²/n). The half-width is z × √[p̂(1 − p̂)/n + z²/(4n²)] / (1 + z²/n). The lower and upper limits are the center minus and plus that half-width.
The calculator uses 1.645, 1.960 and 2.576 for the 90%, 95% and 99% levels respectively, and displays results as percentages. It uses the Wilson score method because its interval respects the zero-to-one range and avoids a common problem with the simple Wald formula. NIST documents the Wilson calculation and its relationship to inverting a score test.
Supporting reading: [1]
Check the study design before using the result
This calculator models a single binomial proportion: each observation is classified as success or not-success, the count is integer-valued, and the observations are treated as independent draws under a simple random-sampling interpretation. The number of successes cannot exceed the total. The calculation alone cannot verify those assumptions.
Do not treat this simple interval as a design-based answer for weighted, clustered, stratified or otherwise complex survey data. Those designs require variance estimation that reflects their selection probabilities and structure. The CDC/NCHS guidance describes design effects and effective sample size for complex surveys; consult a statistician or the method required by your course when your design needs those adjustments. A mathematically valid interval can still be misleading when the denominator, selection process or variance method is wrong.
Supporting reading: [2]
Sample-size planning and post-data estimation are different tasks
Use this page after you have an observed count and total. If you are still planning a probability-based survey and need to choose a completed-response target for a desired margin of error, use the related survey sample-size calculator instead. A planned target and a confidence interval calculated from collected data answer different questions.
For a results paragraph, pair the interval with a plain-language description of the population, sampling frame, dates, response handling and method. Then explain the interval in context without implying that it corrects bias or proves a causal effect.
Supporting reading: [3]
Questions about this topic
How do I calculate a confidence interval for a proportion?
Enter the count in the category of interest, the total number of observations and the confidence level. The page calculates the observed proportion and a two-sided Wilson score interval.
What is a Wilson score interval?
It is a method for estimating a confidence interval for one binomial proportion by inverting a score test. Unlike the simple Wald interval, the Wilson limits stay within the possible zero-to-one range.
What does a 95% confidence interval mean?
Under repeated sampling and the method’s assumptions, about 95% of intervals constructed with a 95% procedure would contain the fixed population proportion. It does not assign a 95% probability to the parameter being inside this already calculated interval.
Can I use this for a weighted or clustered survey?
No. This basic calculator assumes independent observations and a simple binomial model. Complex survey estimates need a method that accounts for weights, clustering, stratification and the sampling design.
Should I use a sample-size calculator instead?
Use this calculator for a proportion observed in data already collected. Use a sample-size calculator before collection to plan a target for a chosen confidence level, margin of error and expected proportion.
Are my counts sent to AI Essay?
No. The calculation runs in your browser, and the counts you enter are not uploaded to AI Essay.
Sources and editorial notes
The supporting reading below informs our editorial guidance. Exercises and scenarios illustrate a method; they do not report a completed product test or measured learning outcome. Read our editorial policy or send a correction with a supporting source to info@ai-essay.com.