 AI Essay
On this page
When Cohen's d fits
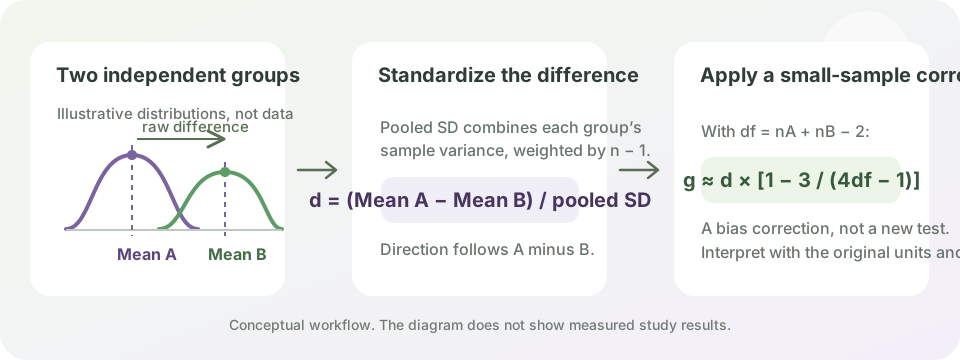
Use this version of Cohen's d to describe the difference between the means of two independent groups when a pooled standard deviation is appropriate. Examples include two separate classes or a treatment and comparison group. The calculator reports Group A minus Group B, so a positive value means the entered Group A mean is higher.
This is a standardized description of a mean difference, not a significance test. It does not calculate a p-value, confidence interval, treatment effect or causal conclusion. The groups must be independent, observations within each group must fit the study design, and the pooled-SD interpretation is most appropriate when the group variances are reasonably similar.
Formula and a worked example
The pooled standard deviation is sₚ = √[((n₁ − 1)s₁² + (n₂ − 1)s₂²) ÷ (n₁ + n₂ − 2)]. Cohen's d is (M₁ − M₂) ÷ sₚ. Here M is a group mean, s is its sample standard deviation, and n is its sample size. The calculator uses the sample-size-weighted pooled variance; it does not take a simple average of the two standard deviations.
Constructed example: Group A has a mean of 80, sample SD 10 and n = 25; Group B has a mean of 74, sample SD 12 and n = 25. The raw mean difference is 6 points and the pooled SD is about 11.05 points, giving d ≈ 0.543. With 48 degrees of freedom, the small-sample correction factor is about 0.984, giving Hedges' g ≈ 0.535 when rounded to three decimal places. These values demonstrate the calculation; they are not study findings or a judgment about educational importance.
Why the calculator also reports Hedges' g
Cohen's d has a small upward bias as an estimate of the population standardized difference, particularly in smaller samples. Hedges' g applies a correction based on the degrees of freedom. This calculator uses the common approximation J ≈ 1 − 3 ÷ (4df − 1), then reports g = J × d. It labels the correction as approximate so readers can distinguish it from an exact gamma-function correction.
For meta-analysis or a paper that specifies a particular effect-size estimator, check the method and software convention required by that project. A standardized mean difference must use a consistent definition across studies before estimates can be combined.
Supporting reading: [2]
Interpret the standardized difference with the outcome
A value such as d = 0.54 means the entered group means differ by about 0.54 pooled sample standard deviations in the stated direction. It does not, by itself, say whether the difference is educationally important, reliable, unbiased or likely to replicate. A generic small/medium/large label cannot replace the outcome scale, study design, uncertainty and field-specific evidence.
Report the raw mean difference and its units beside d or g. For a real analysis, also report group sizes, the spread of each group, the study context and an appropriate confidence interval or inferential analysis. This calculator does not derive uncertainty intervals or verify the data.
Supporting reading: [2]
Choose a different method for paired or unequal-variance data
Do not use this pooled-SD calculator for before-and-after measurements from the same participants or matched cases. Those designs have within-pair dependence, and several standardized effect-size definitions are possible. Use a paired procedure and state the effect-size convention that matches the study question.
If group variances differ substantially or the study uses weighting, clustering, repeated measures or another complex design, a pooled-SD d may be inappropriate. Select a method that matches the design and consult the analysis plan or a statistician. A calculator cannot decide that the common-variance assumption is reasonable.
Free Cohen's d calculator
Compare two independent group means
Enter each group's mean, sample standard deviation and sample size. Results use Group A minus Group B.
Group A: mean 80, SD 10, n 25. Group B: mean 74, SD 12, n 25. The raw difference is 6 points and Cohen's d is about 0.543.
Your calculation runs in this browser. The values you enter are not sent to AI Essay.
The constructed example is ready. Edit the group summaries, then calculate.
Effect-size summary
Raw mean difference (A − B)
Pooled standard deviation
Cohen's d
Hedges' g (approximate correction)
Degrees of freedom
This is a standardized description of two independent means. It is not a significance test or a judgment of practical importance. Review the study design, variance assumptions and raw outcome units.
Questions about this topic
How do I calculate Cohen's d for two independent groups?
Subtract Group B's mean from Group A's mean, then divide by the sample-size-weighted pooled standard deviation. This calculator shows the raw difference, pooled SD, Cohen's d and approximate Hedges' g.
What information do I need for an independent-groups Cohen's d calculator?
Enter each group's mean, sample standard deviation and sample size. The calculator requires at least two observations per group and a nonzero pooled standard deviation.
What does a positive Cohen's d mean here?
This calculator subtracts Group B from Group A. A positive d means Group A's entered mean is higher; a negative value means it is lower. The sign does not indicate whether the difference is desirable.
What is Hedges' g, and why is it different from Cohen's d?
Hedges' g applies a degrees-of-freedom correction to reduce the small-sample upward bias of Cohen's d. This calculator uses the common approximate factor J = 1 − 3/(4df − 1).
Does Cohen's d tell me whether a result is statistically significant?
No. Cohen's d describes a standardized mean difference. It is not a p-value, confidence interval or test of a null hypothesis.
Can I use this calculator for before-and-after measurements?
No. Repeated measurements from the same people are paired, so their dependence matters and the appropriate standardized effect-size definition differs. Use a method designed for paired data and follow the convention required by your study.
Does this calculator label an effect small, medium or large?
No universal label is applied. Interpret the standardized difference with the raw outcome units, uncertainty, study design and relevant field evidence.
Are the values I enter uploaded?
No. The calculation runs in this browser tab; values entered here are not sent to AI Essay.
Sources and editorial notes
The supporting reading below informs our editorial guidance. Exercises and scenarios illustrate a method; they do not report a completed product test or measured learning outcome. Read our editorial policy or send a correction with a supporting source to info@ai-essay.com.